A new report from the United Nations Office on Drugs and Crime reveals a US$1.5 billion discrepancy in the pricing of log exports from Papua New Guinea.
The report is based on a ‘mirror analysis’ of official trade data from PNG and the Republic of China, which is the primary destination for PNG log exports.
The UNODC report says the discrepancy in prices ‘raises the suspicion of trade-based money laundering’ and ‘that Papua New Guinea may have lost the opportunity of collecting revenues, with related taxation and foreign currency remittances for a value of US$ 1.5 billion’.
Below you can read the full UNODC findings on PNG’s log export prices.
UNODC, Global Analysis on Crimes that Affect the Environment – Part 2a: Forest Crimes: Illegal deforestation and logging (United Nations publication, 2025).
April 2025
MIRROR TRADE ANALYSIS
Despite representing only legal flows, trade data has been used to identify routes at risk of criminal activities. Trade account balances offer an overview of the main international flows in wood and derived products. Discrepancies between import and export statistics may be due to many factors including data gaps and lack of comparability. While these discrepancies cannot be taken as a measure of illegal or unregulated trade, they can still help to spot geographical areas potentially at risk. By comparing imports and exports accounts, the use of “mirror data” has enabled national authorities to carry out targeted checks for customs fraud and irregularities.[1], [2], [3]
This analysis is only indicative of potential irregularities as several factors unrelated to criminal activity can explain differences in trade data.[4] Discrepancies may be due to the following factors: (i) data quality may vary aong countries, (ii) for a given country, imports are usually recorded with more accuracy than exports because imports generally generate tariff revenues while exports do not, (iii) a same good may be recorded in different categories by the exporter and the importer,[5] (iv) timing and currency valuation may change across countries: long sea cargo, delayed customs processing or storing in warehouses can lead to trade being recorded in different years and goods being valued at different prices due to exchange rate volatility, (v) storage in bonded warehouses and down- stream transformation in industrial free zones leads to mismatch.[6] Finally, literature suggests that such analysis should be carried out at the finest possible level of detail and complemented by qualitative analysis.[7]
As an example, UNODC conducted a mirror trade analysis of log import and exports between Papua New Guinea and China.[8] While the exact reason for the USD 1.5 billion discrepancy (see below) between export values from Papua New Guinea and import values to China between 2018 and 2022 is unknown, the amount of the difference raises the suspicion of trade-based money laundering. In such instances, values are manipulated to avoid import and/or export duties and tariffs thus saving costs for the corporations involved but negatively impacting governments which lose out on revenue.
DISCREPANCIES BETWEEN LOG IMPORT AND EXPORT COUNTRIES
Since 2010, Papua New Guinea has exported logs to China. During the sample period from 2018 to 2022, China remained the top destination for Papua New Guinea’s timber exports, as reported by SGS Log Export Monitoring Monthly Reports. Throughout this period, 84 per cent of all Papua New Guinea logs exported went to China, with the remainder distributed among 11 other destinations.
The data from the SGS reports were compared with official statistics provided by the General Administration of Customs of the People’s Republic of China (PRC).
Given that China represents the major market for Papua New Guinea’s log exports, a comprehensive analysis of the discrepancies between the data reported by the two countries was deemed essential.
The World Bank claims[9] that:
In a perfect world, country A reported imports from country B would match with country B reported exports to country A. Consequently, this would make mirroring (using information from the partner when a country does not report its trade) a transparent and error-free process.
However, this is not the case for the following reasons:
- In UN COMTRADE, imports are recorded cif (cost insurance and freight) while exports are fob (free on board). This may represent a 10 per cent to 20 per cent difference.
- Despite all efforts made by national and inter-national agencies, data quality may vary among countries.
- For a given country, imports are usually recorded with more accuracy than exports because imports generally generate tariff revenues while exports don’t.
- At a detailed level, a same good may be recorded in different categories by the exporter and the importer.
The table below shows a volume discrepancy of 61,839 m3 between SGS recorded log exports of Papua New Guinea and China’s recorded imports from 2018 to 2022, amounting to 0.44 per cent. As the volume is not affected by differences in CIF and FOB figures, which only apply to values, this volume difference may be due to shipments reported by SGS at the end of 2022 but recorded in China in early 2023. A study on discrepancies in Chinese logs suggests that analyzing quarterly data and including shipment duration between import and export countries can better reveal discrepancies in international timber trade.[10] Although detailed data were limited, the research concluded that the 0.44 percent difference in a total of five can be considered close to zero and normal. However, unaccounted shipments might also contribute to this discrepancy.
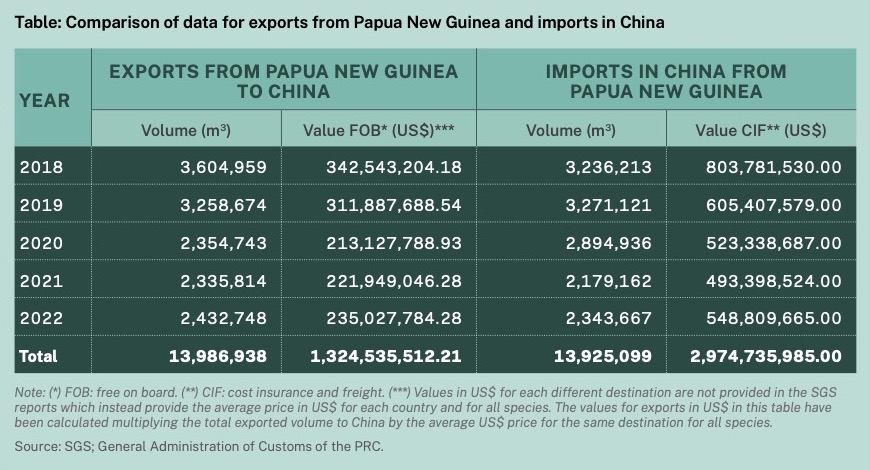
In contrast, the values reported by the two countries show significant differences. Papua New Guinea reported US$ 1.3 billion in value, while China reported US$ 2.9 billion, a discrepancy of US$ 1.6 billion, or 125 per cent of the value reported by SGS for Papua New Guinea in the same period (2018 to 2022) for nearly the same volume.
The World Bank suggested that differences in CIF and FOB values might explain 10-20 per cent of this discrepancy. Data on CIF values for Papua New Guinea’s shipments is unavailable, as SGS records only FOB values, and detailed CIF values for logs imported to China were also unavailable.
The International Monetary Fund (2018) in its working paper on “New Estimates for Direction of Trade Statistics” suggests that:
Exports and imports of non-reporting countries are estimated based on the assumption of symmetry with the values of imports and exports, respectively, declared by their counterpart countries. A CIF/FOB adjustment of 6 percent is used for non-reporting countries. The value of exports is equal to the value of imports from a partner divided by 1.06; the value of imports is equal to the value of exports multiplied by 1.06.
Given the limited data on CIF-FOB margins for the two countries, a 6 per cent adjustment is advisable for more accurate estimates. For the period 2018-2022, the export value of Papua New Guinea should be calculated by dividing China’s imports (US$2,974,735,985.00) by 1.06.
The estimated value of Papua New Guinea exports for the 2018-2022 period is US$ 2,806,354,702.83, calculated by dividing China’s imports US$ 2,974,735,985.00 by 1.06. According to the IMF methodology, which references OECD research, there is a discrepancy between the SGS reported value (US$ 1.3 billion) and the imports recorded in China (US$2.8 billion after CIF/FOB adjustment). This discrepancy amounts to US$ 1.5 billion over five years, accounting for 113 per cent of the FOB values recorded by SGS.
It can be estimated that there is a gap in terms of value declared at export for logs shipped from Papua New Guinea to China, with the discrepancy amounting to around 113 per cent of reported FOB. During 2018- 2022, it can be estimated that Papua New Guinea may have lost the opportunity of collecting revenues, with related taxation and foreign currency remittances, for a value of US$ 1.5 billion.
The presence of discrepancies in trade data may suggest the involvement of offshore intermediaries facilitating the Papua New Guinea-China log trade. These intermediaries would presumably generate taxable income from buying logs in Papua New Guinea and selling them in China. However, it appears that the Chinese importers have direct, long-standing relationships with Papua New Guinea exporters.11 One of the possible supply chains, specifically between Papua New Guinea and China, is that exporters purchase logs directly and then sell them to Chinese sawmills after import. This suggests that there are likely no additional intermediaries inflating the value of Papua New Guinea logs before they reach China.
Download the full UNODC report - https://www.unodc.org/documents/data-and-analysis/Crimes%20on%20Environment/ECR25_P2a_Deforestation.pdf
Footnotes
1. Anne-Marie Geourjon Montagnat-Rentier Bertrand Laporte,Gilles, ‘The Use of Mirror Data by Customs Administrations: From Principles to Practice’, IMF Technical Notes and Manuals No. 2023/005, 2023, https://www.imf.org/en/Publications/TNM/ Issues/2023/09/26/The-Use-of-Mirror-Data-by-Customs-Administrations-FromPrinciplestoPractice-537562.
2. Christopher Grigoriou, Frank Kalizinje, and Gael Raballand, ‘How Helpful Are Mirror Statistics for Customs Reform? Lessons From a Decade of Operational Use’, World Customs Journal 13, no. 2 (30 September 2019): 105–14, https://doi.org/10.55596/001c.116217.
3. Frank Kalizinje, ‘Combating Customs Revenue Fraud in WCO East and Southern African Region: A Mirror Analysis Through the Lens of Malawi’, Global Trade and Customs Journal 13 (1 May 2018): 224–33, https://doi.org/10.54648/GTCJ2018024.
4. Carlotta Schuster and Júnior Davis, ‘Old Dog, New Tricks? The Fitness of Mirror Trade Analysis to Detect Illicit Financial Out- flows from Africa’, 2020, https://www.semanticscholar.org/paper/ Old-dog%2C-new-tricks-The-fitness-of-mirror-trade-to-Carlotta- Schuster/e3eaa16ffa9735ec9d24cea2e8238f85cfe57f48.
5. The World Bank, ‘World Integrated Trade Solution (WITS). Im- ports, Exports and Mirror Data with UN COMTRADE’, accessed 12 November 2024, https://wits.worldbank.org/wits/wits/witshelp/ content/data_retrieval/T/Intro/B2.Imports_Exports_and_Mirror.htm.
6. Schuster and Davis, ‘Old Dog, New Tricks?’
7. Montagnat-Rentier, ‘The Use of Mirror Data by Customs Administrations’.
8. UNODC, ‘Transnational Organized Crime in the Pacific: Expansion, Challenges and Impact’, 2024.
9. UNODC, “Wildlife, Forest & Fisheries Crime Module 4 Key Issues: How Is It Done and Who Is Involved?,” 2022. Accessed at: https://sherloc.unodc.org/cld/en/education/tertiary/wildlife-crime/ module-4/key-issues/how-is-it-done-and-who-is-involved. html.
10. Liu F. et al., “Sustainable Timber Trade: A Study on Discrepancies in Chinese Logs and Lumber Trade Statistics,” 2020.
11 Bin X. et al, “An empirical analysis of the legality and traceability of Chinese imports of Papua New Guinea timber,” Forestry World, 2019. Accessed on June 2020. Accessed at: https://doi.org/10.12677/ WJF.2019.81001.